Data Exploration
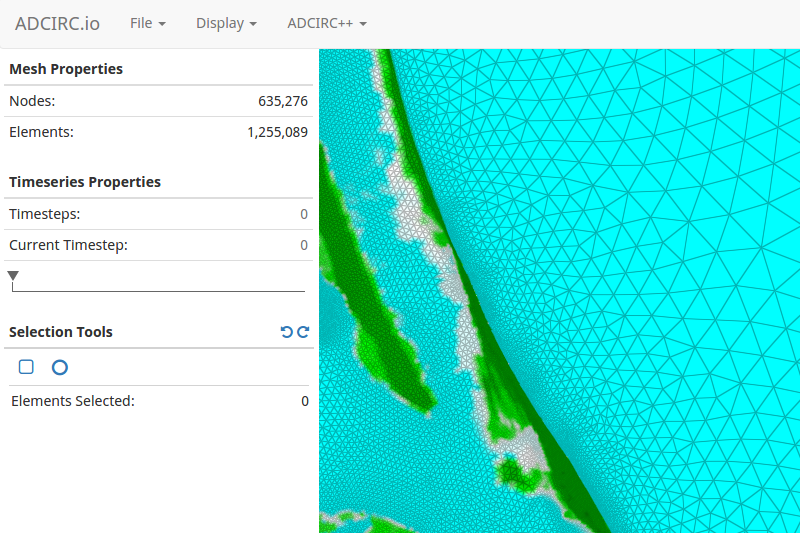
ADCIRC.io allows you to visually explore and interact with all of your ADCIRC data. Validate your meshes by seamlessly visualizing and interacting with them in 2D or 3D. Explore maxes, mins, and full timeseries datasets with powerful interactive animation tools. ADCIRC.io is the tool you need to get at the data you want, all from within the browser.

Powerful Plotting Tools
In addition to interactive mesh visualization and interaction tools, ADCIRC.io has built in plotting tools capable of producing publication quality plots and charts for all of the timeseries data generated by your ADCIRC runs. Plots can be built by choosing nodes from your mesh in ADCIRC.io, or if you don’t need to see your mesh, the same plotting features are available using the standalone ADCIRC.io Plotting Tools.
Recent Blog Posts